Multiple Choice
Identify the
choice that best completes the statement or answers the question.
|
|
|
The image below shows a lipid bilayer with a representation
of a particulat type of membrane transport. Labels 1 and 2 indicate the compartments and do not
identify any structures.
|
|
|
1.
|
Based on the above image which of the following is a
incorrect statement?
a. | The concentration gradient of X would predict that X would flow
from compartment 1 to compartment 2. | b. | X is a polar
molecule | c. | The membrane is selectively permeable. | d. | X is being actively transported against it’s concentration
gradient. | e. | When only considering the concentration of X, the compartment
labeled 2. is hypertonic to compartment 1 |
|
|
|
The following graph shows enzymatic activity of two
different enzymes at different pH. Each reaction is measured by how much product (mL/minute) is made
for each enzymatic reaction.
|
|
|
2.
|
Which of the following statments can be directly
supported from the data collected in this graph?
a. | Both enzymes have excellent reactivity at all pH’s.
| b. | Both enzymes are functional under limited pH
ranges | c. | Both enzymes are highly functional at very basic pH’s.
| d. | Glucose 6-phosphatase is activated by a
cofactor. | e. | The optimal pH of pepsin gives a higher rate of product than
glucose 6-phosphatase at it’s optimal pH. |
|
|
|
3.
|
Which of the following statements is FALSE?
a. | Pepsin’s optimal pH is pH 2. | b. | Pepsin is denatured at pH 8. | c. | Both enzymes have limited
function at pH 5. | d. | Glucose 6-phosphatase has
an optimal pH at 8 | e. | Glucose 5 phosphatase has
limited function but still producing product at pH 4. |
|
|
|
The following image shows a concentration gradient with a
selectively permeable membrane. Assume the membrane is freely permeable by the solute shown in
compartment 1.
|
|
|
4.
|
Assume the image above shows the system at time 0 minutes.
If you return to the system after 20 minutes, which best describes the results you would expect to
find
a. | the system reached equilibrium | b. | some of the solute moved from compartment 1 to compartment
2. | c. | equal amounts of solute is moving in either direction at any
given moment. | d. | relatively equal
concentrations of solute on either side of the membrane. | e. | all of the above are correct statements |
|
|
|
The following image is a U-tube with an unknown solute
dissolved into water divided by a selectively permeable membrane. Assume that the membrane
impermeable to the solute but freely permeable to water.
|
|
|
5.
|
Assume this sytem is shown at time 0 minutes. Whixh of the
following statements would best describe what happens to the system after 20 minutes?
a. | The solute would move until there is equal concentrations of
solute on both side of the membrane | b. | The water will move from
side 2 to side 1. | c. | The water will move from
side 1 to side 2 | d. | The solute will diffuse
from side 2 to side 1. | e. | Both the water and the
solute will move from side 1 to side 2. |
|
|
|
The following image shows a cell doing bulk
transport.
|
|
|
6.
|
The above image is showe a type membrane transport. Which of
the following best describes this type of transport?
a. | Active transport | b. | Passive transport | c. | facilitated
diffusion | d. | pinocyctosis | e. | phagocytosis |
|
|
|
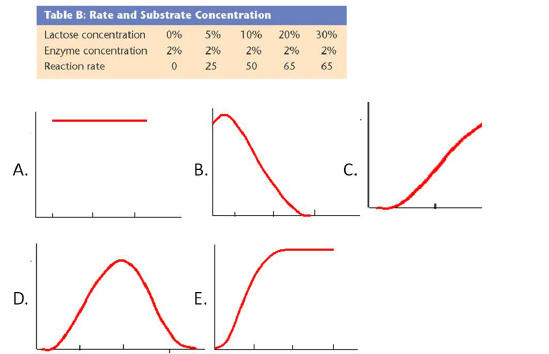
The following question uses the information from the table
below to create one of the graphs below.

|
|
|
7.
|
Given the above data set for Enzyme Rate and Substrate
Concentration, which graph best describes the trend from the data?
|
|
|
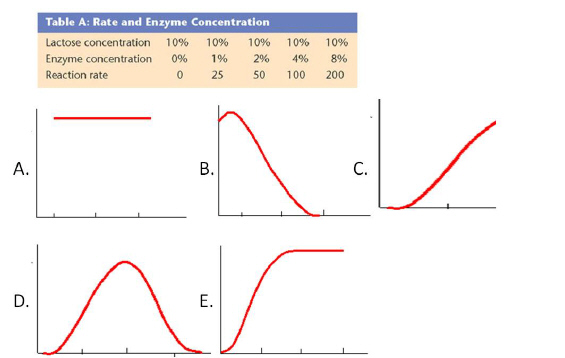
The data set below was collected and then graphed.

|
|
|
8.
|
Which of the above graphs correctly match the data
collected?
|
|
|
Answer the following questions
based on the diagram below:
|
|
|
9.
|
This diagram shows
a:
a. | Dehydration synthesis
reaction. |
b. | hydrolysis reaction. |
c. | Formation of a peptide
bond. |
d. | Both (a) and (c) above. |
e. | None of the
above. |
|
|
|
10.
|
What molecule should be
identified in place of (3)?
a. | Inhibitor. |
b. | Enzyme. |
c. | Water. |
d. | Inhibitors. |
e. | None of the above. |
|
|
|
11.
|
Which statement(s) are
true?
a. | Enzymes facilitate reactions by
lowering activation energy. |
b. | This single enzyme is able to catalyze many different reactions by binding
various substrates. |
c. | Once an enzyme catalyzes a reaction, it is disabled or “used
up”. |
d. | Enzymes are lipids. |
e. | Enzymes only catalyzes reactions that break down
molecules. |
|
|
|
12.
|
What binds to the region
labeled (2)?
a. | Substrate. |
b. | Competitive inhibitor. |
c. | Noncompetitive
inhibitor. |
d. | Both (a) and (b). |
e. | All of the above. |
|
|
|
13.
|
The region where the substrate
binds this enzyme is called the:
a. | active
site. |
b. | promoter. |
c. | operon. |
d. | plasmid. |
e. | inner thylakoid space. |
|
|
|
The diagram below shows a
transmembrane protein (a protein embedded in the lipid bilayer) that acts as a channel to transport
molecules across the membrane. You should recognize the parts of the lipid bilayer by comparing them
to an earlier question which shows the membrane in the same view.
The boxed area highlights
details of the protein chain that sits in the membrane. Each “R” represents a
separate sidechain and is labeled 1 through 5. Answer the following questions based on your
understanding of the structure and characteristics of amino acids, proteins, and the lipid bilayer.
|
|
|
14.
|
This channel protein, the
potassium channel, facilitates the movement of potassium ions across the cell membrane by what would
be referred to as “facilitated diffusion”. Which of the following would be
true about the functions of
this protein?
a. | The protein is capable of moving all
dissolved solutes across the membrane. |
b. | The channel requires ATP as energy to
function. |
c. | The net movement of the potassium through the protein continues in one
direction as long as ATP is available. |
d. | The net movement of the potassium through the protein would stop when its
concentration reaches equilibrium across the membrane. |
e. | Both (a) and (b)
above. |
|
|
|
Answer the following questions
based on the diagram below. 1, 2, and 3 represent the process. 4 and
5 represents the highlighted structure.
|
|
|
15.
|
Which part(s) of the diagram
represents facilitated diffusion?
a. | 1 |
b. | 2 |
c. | 3 |
d. | Both 1 and 2 |
e. | All 1, 2, and
3 |
|
|
|
16.
|
Which part(s) of the diagram
represents a type of passive
transport?
a. | 1 |
b. | 2 |
c. | 3 |
d. | Both 1 and 2 |
e. | All 1, 2, 3 |
|
|
|
17.
|
Which part of the diagram
represents a type of transport that is able to establish an area of higher solute concentration by
moving molecules against a concentration gradient?
a. | 1 |
b. | 2 |
c. | 3 |
d. | All 1, 2, and 3 |
e. | None of the
above |
|
|
|
18.
|
The structures labeled (4) and
(5)
a. | are types of
proteins. |
b. | are channel proteins. |
c. | contain hydrophobic amino acids that help the remain
stabilized in the lipid bilayer. |
d. | are made up of amino acids. |
e. | All of the
above. |
|
|
|
19.
|
The function of ATP synthase is
dependent on the movement of hydrogen ions moving down a concentration gradient. Which of the
illustrations best describes the movement of hydrogen ions through ATP synthase.
a. | 1. |
b. | 2. |
c. | 3. |
d. | 1 and 2. |
e. | All of the
above. |
|
|
|
20.
|
Oxygen is a small, non polar
molecule. Which of the following best shows its passage through the cell
membrane
a. | 1 |
b. | 2 |
c. | 3 |
d. | 1 and 2- when at the inner mitochondrial
membrane |
e. | 1 and 4- 4 only when under anaerobic
conditions |
|
|
|
Answer the following questions
based on the diagram below and your understanding of the mechanisms of diffusion and osmosis.
It will help to recall the observations made during the diffusion lab.
A beaker is set up with
the following initial conditions. The bag in the beaker is made up of dialysis
tubing.
|
|
|
21.
|
Starch is not able to pass
through this membrane; IKI, glucose, sucrose, and water can. Which of the following will be
false?
a. | After 60 minutes, only the water in
the beaker will be stained a dark black. |
b. | After 60 minutes, only the water in the bag will be stained
black. |
c. | After 60 minutes, the IKI will diffuse into the
bag. |
d. | After 60 minutes, both the water in the beaker and the bag will test positive
with Benedicts. |
e. | The water initially placed in the beaker will test positive for
Benedicts. |
|
|
|
22.
|
Imagine the same experimental
setup as the earlier question. In this experiment, both starch and sucrose are not able to pass through
the membrane. IKI, glucose, and water can still pass through.
Which of the following
will be true about the appearance and characteristics of the system after 60
minutes?
a. | The water in the beaker will show a
positive IKI test. |
b. | The water inside the bag will test negative with
Benedicts. |
c. | There will be a net movement of water into the
bag. |
d. | There will be a net movement of water out of the
bag. |
e. | There will be no net movement of water between the bag and the
beaker. |
|
|
|
Answer the following questions using the diagram below. Each question
may require you to make different assumptions for the conditions represented in the diagram.
Read the question carefully before selecting an answer.
|
|
|
23.
|
The dialysis bag is filled with
20% sucrose solution. Which beaker contains a solution that is hypotonic to the solution inside the dialysis
bag?
a. | Beaker
1 |
b. | Beaker
2 |
c. | Beaker
3 |
d. | Both beaker 2 and
3 |
e. | Not enough information to
determine |
|
|
|
24.
|
Again, the bag is filled with
20% sucrose solution. Which statement is false about the dialysis bag used in the above experiment?
a. | The dialysis bag is selectively
permeable. |
b. | The dialysis bag is permeable to water. |
c. | The dialysis bag is permeable to
sucrose. |
d. | Both (b) and (c) are false. |
e. | All statements are
false. |
|
|
|
25.
|
The dialysis bag is filled with
a 20% glucose solution. Glucose is able to pass through the dialysis membrane. Which of
the three beakers would resemble the appearance of the bag after being placed in pure water for 30
minutes?
a. | Beaker
1 |
b. | Beaker
2 |
c. | Beaker
3 |
d. | None of the
above |
e. | Not enough information to
determine |
|
|
|
26.
|
The process seen here is the
movement of water across a selectively permeable membrane because of a difference in solute
concentration. This is called:
a. | Osmosis. |
b. | Active transport. |
c. | Endocytosis. |
d. | Bulk transport. |
e. | Mass transit. |
|
|
|
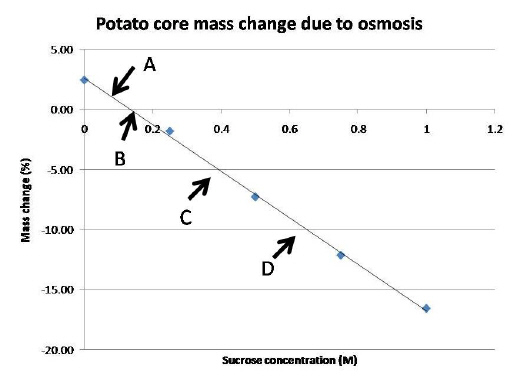
The following graph is based on potato cores soaked in
various concentrations of sucrose for twenty for house.

|
|
|
27.
|
Using the graph above, the average mass of the potato core
soaked in pure water tends to
a. | gain mass | d. | lose
water | b. | lose mass | e. | both a and
c | c. | gain water | f. | both b and
d |
|
|
|
28.
|
The potato cores in .25 M concentration of sucrose are said
to be in ----.
a. | isotonic solution since they lose mass | b. | hypotonic solution since they gain mass | c. | hypertonic solution since they lose mass | d. | saline solution since the cores gain mass | e. | both b and d are correct |
|
|
|
29.
|
Which of the following statement(s) is/are
correct?
a. | The area marked A is referring to a hypertonic
solution | b. | The area marked B is referring to an isotonic
solution | c. | The area marked C is referred to as a weak
solution | d. | The area marked D is referred to as a hypertonic
solution | e. | Both B and D are corrent |
|
|
|
The following shows a lipid bilayer with an embedded
protein. The red circles are solutes are in the aqueous environment. Labels 2 and 3 referring to the
compartments: ICF or ECF
|
|
|
30.
|
Based on the above diagram, it can be assumed that the
solute particles are ---- and ---.
a. | nonpolar.....must move through a transport
protein | b. | polar.....must move through a transport
protein | c. | hypertonic....and must move through a transport
protein | d. | hypotonic.....and will move down it’s concentration
gradient | e. | polar.....can move through the lipid
bilayer |
|
|
|
31.
|
Which of the following statements regarding the above
diagram is (are) false?
a. | The solute particles are moving down their concentration
gradient? | b. | The solute particles are moving via the process of facilitated
diffusion | c. | The solute particles are polar | d. | The diagram is showing active transport of solute particles | e. | The diagram is passive transport |
|
|
|
32.
|
Which of the following statements is true about the above
diagram.
a. | Area 3 is hypertonic to area 2 | b. | Area 3 is hyportonic to area 2 | c. | Area 2 is hypotonic to area
3 | d. | Area 2 is hypertonic to area 3 | e. | both a and c are true |
|
|
|
The following image is a a picture of an onion cell. The
cells have a unique stain that stains the entire cytoplasm of the cell.
|
|
|
33.
|
Observing the above diagram, which of the following
statements is false?
a. | The observed cells are in a hypertonic
environment. | b. | The observed cells are in a
hypotonic environment. | c. | The observed cells are
losing water to the environment | d. | The observed cells are
eukaryotic. | e. | The observed cells are
shrinking in volume. |
|
|
|
34.
|
In which of the following is solution X hypotonic relative
to solution Y?
a. | Solution X has a greater solute concentration than
Y. | b. | Solution X has a lower solute concentration than solution
Y. | c. | Solution X and solution Y have the same solute
concentration. | d. | all of the
above | e. | none of the above |
|
|
|
35.
|
A marathon runner has just arrived in the emergency room
with severe dehydration, and you, the physician, must decide which type of solution to pump into his
veins: pure water, 0.9 % saline, 1.5 % saline. (Hint: Blood cells are approximately 0.9 saline)
Which solution should you use to correctly treat the patient?
a. | Since the runner is critically dehydrated, you should use pure
water. This puts the cells in a hypotonic environment and water will rush into the cell rehydrating
the cells. | b. | You should use the 1.5
saline since this will force the cells to uptake water from the surrounding
environment. | c. | You should use the .0.9
saline since this isotonic to body tissues. | d. | You should use the .9
saline since this will be hypertonic to a severely dehydrated runner. | e. | You should use the pure water since this will place the cells in a hypertonic
environment and rehydrate the cells. |
|